
Technical and fundamental analysis of U.S. oil (WTI)
Overview: U.S. crude oil (WTI) trades at 82.60-82.80 levels after a drop of more than 1%, following data from the American Petroleum Institute showing that U.S crude inventories rose by 5.3 million barrels in the week ending November 13, with gasoline inventories rising by...
The overview:
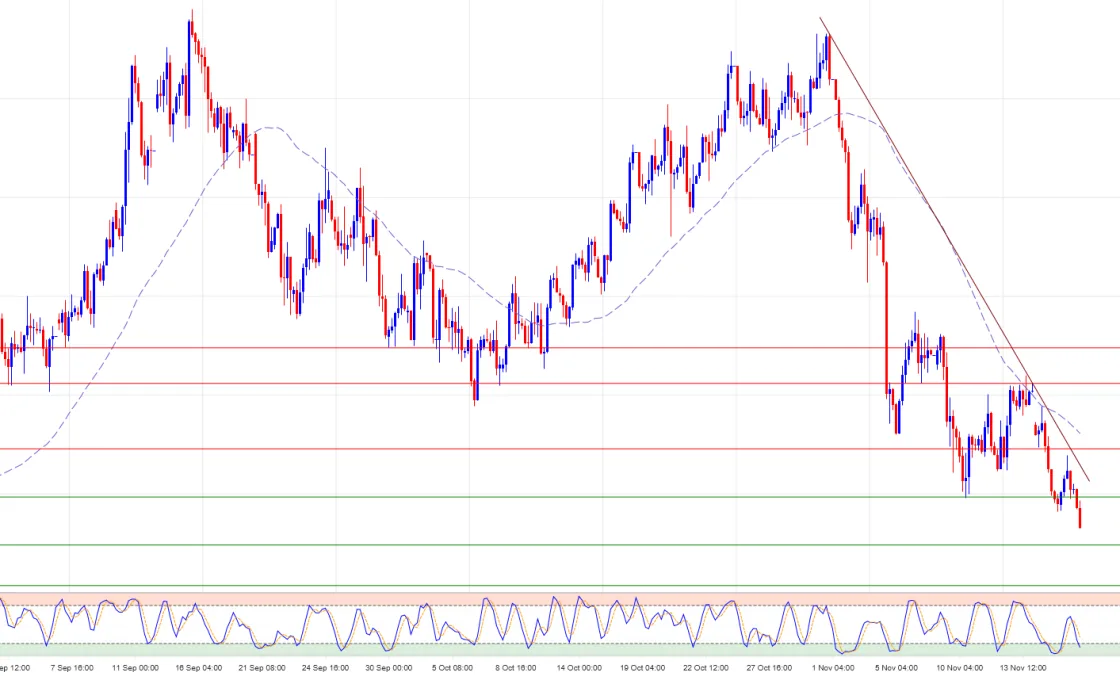
U.S. Oil (WTI) trades at 82.60-82.80 levels after falling more than 1%, following data from the American Petroleum Institute that showed U.S crude inventories up 5.3 million barrels in the week ending November 13, with gasoline inventories up 5.1 million barrels. Crude was up yesterday after the US and Iran exchanged blows, but the rebound faded quickly. Remarkably, WTI is falling faster than Brent ⁇ the difference between them at their highest level in more than two weeks ⁇ as stocks build up on the US Gulf Coast. Oil is trapped between resistance 84.12-89.38 and support 81.90-80.02. Follow-up: Official stock data today (18:30 Amman time), and the Federal Minutes (22:00).
The technical analysis:
Through the chart attached to the four-hour time frame, we observe that crude rebounded yesterday from ~83.50 to around 85.80 ⁇ below 86.35 and below the sharp downtrend line from a peak of 105.50 ⁇ then was rejected and dropped strong red candles across 84.12, trading at 82.71. A new low high confirms a continuing downward trend. 84.12 became resistance. The price is below the sloping moving average near 87.20. Stochastic at 14.23/29.99 is heading for oversaturation. The next support is 81.90 ⁇ and then 80.02 (bottom of late August), which is the most important support on the chart.
The basic analysis:
Stocks are piling up ⁇ and war is no longer driving up prices: The exchange of strikes between Washington and Tehran yesterday gave crude a rise that didn’t last for hours ⁇ in new evidence that the market is pricing supplies, not risks. US inventory data has risen sharply, and Sparta Commodities analysts show that U.S. crude export windows to Asia and northwestern Europe remain closed, piling up barrels on the U.S Gulf Coast and putting more pressure on WTI than Brent. In contrast: LSEG analysts believe that Hormuz flows cannot yet return to normal under current conditions ⁇ an underlying upside risk. WTI is down about 16% since the beginning of November. Bottom line: The trend is down ⁇ and today’s official stock data could deepen it to 80.02.